
In this post, using a real case dataset of the exit surveys, let’s find out why the employees are leaving.
1. Introduction
In this project, we’ll work with exit surveys from employees of the Department of Education, Training and Employment (DETE) and the Technical and Further Education (TAFE) institute in Queensland, Australia. You can find the TAFE exit survey here and the survey for the DETE here. We’ve made some slight modifications to these datasets to make them easier to work with, including changing the encoding to UTF-8 (the original ones are encoded using cp1252.)
In this project, we’ll play the role of data analyst and pretend our stakeholders want to know the following:
- Are employees who only worked for the institutes for a short period of time resigning due to some kind of dissatisfaction? What about employees who have been there longer?
- Are younger employees resigning due to some kind of dissatisfaction? What about older employees?
We have to combine the results for both surveys to answer these questions. However, although both used the same survey template, one of them customized some of the answers. In the steps, we’ll aim to do most of the data cleaning and get started analyzing these questions.
Below is a preview of a couple columns we’ll work with from the dete_survey.csv:
ID: An id used to identify the participant of the surveySeparationType: The reason why the person’s employment endedCease Date: The year or month the person’s employment endedDETE Start Date: The year the person began employment with the DETE
Below is a preview of a couple columns we’ll work with from the tafe_survey.csv:
Record ID: An id used to identify the participant of the surveyReason for ceasing employment: The reason why the person’s employment endedLengthofServiceOverall. Overall Length of Service at Institute (in years): The length of the person’s employment (in years)
import numpy as np
import pandas as pd

dete_survey = pd.read_csv('dete_survey.csv', encoding = 'utf-8')
tafe_survey = pd.read_csv('tafe_survey.csv', encoding = 'utf-8')

# printing info about dete_survey
dete_survey.info()
print('\n \n ***********')
print(dete_survey.head())
print('\n \n ***********')

# printing info about tafe_survey
tafe_survey.info()
print('\n \n ***********')
tafe_survey.head()
<class 'pandas.core.frame.DataFrame'>
RangeIndex: 822 entries, 0 to 821
Data columns (total 56 columns):
ID 822 non-null int64
SeparationType 822 non-null object
Cease Date 822 non-null object
DETE Start Date 822 non-null object
Role Start Date 822 non-null object
Position 817 non-null object
Classification 455 non-null object
Region 822 non-null object
Business Unit 126 non-null object
Employment Status 817 non-null object
Career move to public sector 822 non-null bool
Career move to private sector 822 non-null bool
Interpersonal conflicts 822 non-null bool
Job dissatisfaction 822 non-null bool
Dissatisfaction with the department 822 non-null bool
Physical work environment 822 non-null bool
Lack of recognition 822 non-null bool
Lack of job security 822 non-null bool
Work location 822 non-null bool
Employment conditions 822 non-null bool
Maternity/family 822 non-null bool
Relocation 822 non-null bool
Study/Travel 822 non-null bool
Ill Health 822 non-null bool
Traumatic incident 822 non-null bool
Work life balance 822 non-null bool
Workload 822 non-null bool
None of the above 822 non-null bool
Professional Development 808 non-null object
Opportunities for promotion 735 non-null object
Staff morale 816 non-null object
Workplace issue 788 non-null object
Physical environment 817 non-null object
Worklife balance 815 non-null object
Stress and pressure support 810 non-null object
Performance of supervisor 813 non-null object
Peer support 812 non-null object
Initiative 813 non-null object
Skills 811 non-null object
Coach 767 non-null object
Career Aspirations 746 non-null object
Feedback 792 non-null object
Further PD 768 non-null object
Communication 814 non-null object
My say 812 non-null object
Information 816 non-null object
Kept informed 813 non-null object
Wellness programs 766 non-null object
Health & Safety 793 non-null object
Gender 798 non-null object
Age 811 non-null object
Aboriginal 16 non-null object
Torres Strait 3 non-null object
South Sea 7 non-null object
Disability 23 non-null object
NESB 32 non-null object
dtypes: bool(18), int64(1), object(37)
memory usage: 258.6+ KB
***********
ID SeparationType Cease Date DETE Start Date \
0 1 Ill Health Retirement 08/2012 1984
1 2 Voluntary Early Retirement (VER) 08/2012 Not Stated
2 3 Voluntary Early Retirement (VER) 05/2012 2011
3 4 Resignation-Other reasons 05/2012 2005
4 5 Age Retirement 05/2012 1970
Role Start Date Position \
0 2004 Public Servant
1 Not Stated Public Servant
2 2011 Schools Officer
3 2006 Teacher
4 1989 Head of Curriculum/Head of Special Education
Classification Region Business Unit \
0 A01-A04 Central Office Corporate Strategy and Peformance
1 AO5-AO7 Central Office Corporate Strategy and Peformance
2 NaN Central Office Education Queensland
3 Primary Central Queensland NaN
4 NaN South East NaN
Employment Status ... Kept informed Wellness programs \
0 Permanent Full-time ... N N
1 Permanent Full-time ... N N
2 Permanent Full-time ... N N
3 Permanent Full-time ... A N
4 Permanent Full-time ... N A
Health & Safety Gender Age Aboriginal Torres Strait South Sea \
0 N Male 56-60 NaN NaN NaN
1 N Male 56-60 NaN NaN NaN
2 N Male 61 or older NaN NaN NaN
3 A Female 36-40 NaN NaN NaN
4 M Female 61 or older NaN NaN NaN
Disability NESB
0 NaN Yes
1 NaN NaN
2 NaN NaN
3 NaN NaN
4 NaN NaN
[5 rows x 56 columns]
***********
<class 'pandas.core.frame.DataFrame'>
RangeIndex: 702 entries, 0 to 701
Data columns (total 72 columns):
Record ID 702 non-null float64
Institute 702 non-null object
WorkArea 702 non-null object
CESSATION YEAR 695 non-null float64
Reason for ceasing employment 701 non-null object
Contributing Factors. Career Move - Public Sector 437 non-null object
Contributing Factors. Career Move - Private Sector 437 non-null object
Contributing Factors. Career Move - Self-employment 437 non-null object
Contributing Factors. Ill Health 437 non-null object
Contributing Factors. Maternity/Family 437 non-null object
Contributing Factors. Dissatisfaction 437 non-null object
Contributing Factors. Job Dissatisfaction 437 non-null object
Contributing Factors. Interpersonal Conflict 437 non-null object
Contributing Factors. Study 437 non-null object
Contributing Factors. Travel 437 non-null object
Contributing Factors. Other 437 non-null object
Contributing Factors. NONE 437 non-null object
Main Factor. Which of these was the main factor for leaving? 113 non-null object
InstituteViews. Topic:1. I feel the senior leadership had a clear vision and direction 608 non-null object
InstituteViews. Topic:2. I was given access to skills training to help me do my job better 613 non-null object
InstituteViews. Topic:3. I was given adequate opportunities for personal development 610 non-null object
InstituteViews. Topic:4. I was given adequate opportunities for promotion within %Institute]Q25LBL% 608 non-null object
InstituteViews. Topic:5. I felt the salary for the job was right for the responsibilities I had 615 non-null object
InstituteViews. Topic:6. The organisation recognised when staff did good work 607 non-null object
InstituteViews. Topic:7. Management was generally supportive of me 614 non-null object
InstituteViews. Topic:8. Management was generally supportive of my team 608 non-null object
InstituteViews. Topic:9. I was kept informed of the changes in the organisation which would affect me 610 non-null object
InstituteViews. Topic:10. Staff morale was positive within the Institute 602 non-null object
InstituteViews. Topic:11. If I had a workplace issue it was dealt with quickly 601 non-null object
InstituteViews. Topic:12. If I had a workplace issue it was dealt with efficiently 597 non-null object
InstituteViews. Topic:13. If I had a workplace issue it was dealt with discreetly 601 non-null object
WorkUnitViews. Topic:14. I was satisfied with the quality of the management and supervision within my work unit 609 non-null object
WorkUnitViews. Topic:15. I worked well with my colleagues 605 non-null object
WorkUnitViews. Topic:16. My job was challenging and interesting 607 non-null object
WorkUnitViews. Topic:17. I was encouraged to use my initiative in the course of my work 610 non-null object
WorkUnitViews. Topic:18. I had sufficient contact with other people in my job 613 non-null object
WorkUnitViews. Topic:19. I was given adequate support and co-operation by my peers to enable me to do my job 609 non-null object
WorkUnitViews. Topic:20. I was able to use the full range of my skills in my job 609 non-null object
WorkUnitViews. Topic:21. I was able to use the full range of my abilities in my job. ; Category:Level of Agreement; Question:YOUR VIEWS ABOUT YOUR WORK UNIT] 608 non-null object
WorkUnitViews. Topic:22. I was able to use the full range of my knowledge in my job 608 non-null object
WorkUnitViews. Topic:23. My job provided sufficient variety 611 non-null object
WorkUnitViews. Topic:24. I was able to cope with the level of stress and pressure in my job 610 non-null object
WorkUnitViews. Topic:25. My job allowed me to balance the demands of work and family to my satisfaction 611 non-null object
WorkUnitViews. Topic:26. My supervisor gave me adequate personal recognition and feedback on my performance 606 non-null object
WorkUnitViews. Topic:27. My working environment was satisfactory e.g. sufficient space, good lighting, suitable seating and working area 610 non-null object
WorkUnitViews. Topic:28. I was given the opportunity to mentor and coach others in order for me to pass on my skills and knowledge prior to my cessation date 609 non-null object
WorkUnitViews. Topic:29. There was adequate communication between staff in my unit 603 non-null object
WorkUnitViews. Topic:30. Staff morale was positive within my work unit 606 non-null object
Induction. Did you undertake Workplace Induction? 619 non-null object
InductionInfo. Topic:Did you undertake a Corporate Induction? 432 non-null object
InductionInfo. Topic:Did you undertake a Institute Induction? 483 non-null object
InductionInfo. Topic: Did you undertake Team Induction? 440 non-null object
InductionInfo. Face to Face Topic:Did you undertake a Corporate Induction; Category:How it was conducted? 555 non-null object
InductionInfo. On-line Topic:Did you undertake a Corporate Induction; Category:How it was conducted? 555 non-null object
InductionInfo. Induction Manual Topic:Did you undertake a Corporate Induction? 555 non-null object
InductionInfo. Face to Face Topic:Did you undertake a Institute Induction? 530 non-null object
InductionInfo. On-line Topic:Did you undertake a Institute Induction? 555 non-null object
InductionInfo. Induction Manual Topic:Did you undertake a Institute Induction? 553 non-null object
InductionInfo. Face to Face Topic: Did you undertake Team Induction; Category? 555 non-null object
InductionInfo. On-line Topic: Did you undertake Team Induction?process you undertook and how it was conducted.] 555 non-null object
InductionInfo. Induction Manual Topic: Did you undertake Team Induction? 555 non-null object
Workplace. Topic:Did you and your Manager develop a Performance and Professional Development Plan (PPDP)? 608 non-null object
Workplace. Topic:Does your workplace promote a work culture free from all forms of unlawful discrimination? 594 non-null object
Workplace. Topic:Does your workplace promote and practice the principles of employment equity? 587 non-null object
Workplace. Topic:Does your workplace value the diversity of its employees? 586 non-null object
Workplace. Topic:Would you recommend the Institute as an employer to others? 581 non-null object
Gender. What is your Gender? 596 non-null object
CurrentAge. Current Age 596 non-null object
Employment Type. Employment Type 596 non-null object
Classification. Classification 596 non-null object
LengthofServiceOverall. Overall Length of Service at Institute (in years) 596 non-null object
LengthofServiceCurrent. Length of Service at current workplace (in years) 596 non-null object
dtypes: float64(2), object(70)
memory usage: 395.0+ KB
***********
.dataframe tbody tr th {
    vertical-align: top;
}

.dataframe thead th {
    text-align: right;
}
Observations
print(dete_survey.isnull().sum().sort_values(ascending = False))
print('\n ******')
print(tafe_survey.isnull().sum().sort_values(ascending = False))
Torres Strait 819
South Sea 815
Aboriginal 806
Disability 799
NESB 790
Business Unit 696
Classification 367
Opportunities for promotion 87
Career Aspirations 76
Wellness programs 56
Coach 55
Further PD 54
Workplace issue 34
Feedback 30
Health & Safety 29
Gender 24
Professional Development 14
Stress and pressure support 12
Skills 11
Age 11
Peer support 10
My say 10
Performance of supervisor 9
Initiative 9
Kept informed 9
Communication 8
Worklife balance 7
Staff morale 6
Information 6
Physical environment 5
Employment Status 5
Position 5
Region 0
Career move to private sector 0
Career move to public sector 0
Role Start Date 0
DETE Start Date 0
Cease Date 0
SeparationType 0
Job dissatisfaction 0
Interpersonal conflicts 0
None of the above 0
Dissatisfaction with the department 0
Physical work environment 0
Lack of recognition 0
Lack of job security 0
Work location 0
Employment conditions 0
Maternity/family 0
Relocation 0
Study/Travel 0
Ill Health 0
Traumatic incident 0
Work life balance 0
Workload 0
ID 0
dtype: int64
******
Main Factor. Which of these was the main factor for leaving? 589
InductionInfo. Topic:Did you undertake a Corporate Induction? 270
Contributing Factors. Ill Health 265
Contributing Factors. Maternity/Family 265
Contributing Factors. Career Move - Public Sector 265
Contributing Factors. NONE 265
Contributing Factors. Other 265
Contributing Factors. Dissatisfaction 265
Contributing Factors. Career Move - Self-employment 265
Contributing Factors. Career Move - Private Sector 265
Contributing Factors. Travel 265
Contributing Factors. Study 265
Contributing Factors. Interpersonal Conflict 265
Contributing Factors. Job Dissatisfaction 265
InductionInfo. Topic: Did you undertake Team Induction? 262
InductionInfo. Topic:Did you undertake a Institute Induction? 219
InductionInfo. Face to Face Topic:Did you undertake a Institute Induction? 172
InductionInfo. Induction Manual Topic:Did you undertake a Institute Induction? 149
InductionInfo. Face to Face Topic:Did you undertake a Corporate Induction; Category:How it was conducted? 147
InductionInfo. On-line Topic:Did you undertake a Institute Induction? 147
InductionInfo. On-line Topic:Did you undertake a Corporate Induction; Category:How it was conducted? 147
InductionInfo. Induction Manual Topic:Did you undertake a Corporate Induction? 147
InductionInfo. Face to Face Topic: Did you undertake Team Induction; Category? 147
InductionInfo. On-line Topic: Did you undertake Team Induction?process you undertook and how it was conducted.] 147
InductionInfo. Induction Manual Topic: Did you undertake Team Induction? 147
Workplace. Topic:Would you recommend the Institute as an employer to others? 121
Workplace. Topic:Does your workplace value the diversity of its employees? 116
Workplace. Topic:Does your workplace promote and practice the principles of employment equity? 115
Workplace. Topic:Does your workplace promote a work culture free from all forms of unlawful discrimination? 108
LengthofServiceOverall. Overall Length of Service at Institute (in years) 106
...
WorkUnitViews. Topic:26. My supervisor gave me adequate personal recognition and feedback on my performance 96
WorkUnitViews. Topic:16. My job was challenging and interesting 95
InstituteViews. Topic:6. The organisation recognised when staff did good work 95
WorkUnitViews. Topic:22. I was able to use the full range of my knowledge in my job 94
WorkUnitViews. Topic:21. I was able to use the full range of my abilities in my job. ; Category:Level of Agreement; Question:YOUR VIEWS ABOUT YOUR WORK UNIT] 94
InstituteViews. Topic:4. I was given adequate opportunities for promotion within %Institute]Q25LBL% 94
Workplace. Topic:Did you and your Manager develop a Performance and Professional Development Plan (PPDP)? 94
InstituteViews. Topic:1. I feel the senior leadership had a clear vision and direction 94
InstituteViews. Topic:8. Management was generally supportive of my team 94
WorkUnitViews. Topic:14. I was satisfied with the quality of the management and supervision within my work unit 93
WorkUnitViews. Topic:19. I was given adequate support and co-operation by my peers to enable me to do my job 93
WorkUnitViews. Topic:20. I was able to use the full range of my skills in my job 93
WorkUnitViews. Topic:28. I was given the opportunity to mentor and coach others in order for me to pass on my skills and knowledge prior to my cessation date 93
WorkUnitViews. Topic:24. I was able to cope with the level of stress and pressure in my job 92
InstituteViews. Topic:3. I was given adequate opportunities for personal development 92
WorkUnitViews. Topic:27. My working environment was satisfactory e.g. sufficient space, good lighting, suitable seating and working area 92
InstituteViews. Topic:9. I was kept informed of the changes in the organisation which would affect me 92
WorkUnitViews. Topic:17. I was encouraged to use my initiative in the course of my work 92
WorkUnitViews. Topic:25. My job allowed me to balance the demands of work and family to my satisfaction 91
WorkUnitViews. Topic:23. My job provided sufficient variety 91
WorkUnitViews. Topic:18. I had sufficient contact with other people in my job 89
InstituteViews. Topic:2. I was given access to skills training to help me do my job better 89
InstituteViews. Topic:7. Management was generally supportive of me 88
InstituteViews. Topic:5. I felt the salary for the job was right for the responsibilities I had 87
Induction. Did you undertake Workplace Induction? 83
CESSATION YEAR 7
Reason for ceasing employment 1
WorkArea 0
Institute 0
Record ID 0
Length: 72, dtype: int64
These are the observations
| characteristic | dete_survey |
tafe_survey |
|---|---|---|
| total number of rows, cols | (822, 56) | (702, 72) |
| Number of null values in each cols (major) | [819, 815, 806, 799, 790, 696, 367, —-] | [589, 270, 265, 265 * 11, 262, 219, 172, —- ] |
dete_surveyhas less number of columns thantafe_surveywhere the columns are missing- Both
dete_surveyandtafe_surveycontains many columns which we won’t be needing to carryout our analysis - In
dete_surveythere are date columns where a string ‘Not Stated’ is listed down. This should be converted as Nan - Many of the columns have duplicated columns with a different column name
2. Identify Missing Values and Drop Unnecessary Columns
dete_survey = pd.read_csv('dete_survey.csv', na_values = 'Not Stated')
dete_survey.iloc[0:5,28:49]
.dataframe tbody tr th {
    vertical-align: top;
}

.dataframe thead th {
    text-align: right;
}
Since the columns from [28:49] and [17:66] in the dataframes, dete_survey and tafe_survey respectively are not useful for our analysis, they can be dropped
print(dete_survey.shape, tafe_survey.shape)
dete_survey.drop(dete_survey.columns[28:49], axis = 1, inplace = True)
tafe_survey.drop(tafe_survey.columns[17:66], axis = 1, inplace = True)
print(dete_survey.shape, tafe_survey.shape)
(822, 56) (702, 72)
(822, 35) (702, 23)
3. Clean column names
There are many duplicate columns with a different column names in the both the datasets. If one looks at the analysis which we are interested in, below are some of the columns which we would like to use for our analysis.
| dete_survey | tafe_survey | Definition |
|---|---|---|
| ID | Record ID | An id used to identify the participant of the survey |
| SeparationType | Reason for ceasing employment | The reason why the participant’s employment ended |
| Cease Date | CESSATION YEAR | The year or month the participant’s employment ended |
| DETE Start Date | The year the participant began employment with the DETE | |
| LengthofServiceOverall. Overall Length of Service at Institute (in years) | The length of the person’s employment (in years) | |
| Age | CurrentAge.Current Age | The age of the participant |
| Gender | Gender.What is your Gender? | The gender of the participant |
Eventually, for our analysis we have to combine both the data sets to gain more insights and answer the two questions which were listed down earlier. Hence, it is of utmost importance to keep the column names same for same cateogories in both the surveys. Also, it would be better if we follow the following so that the column names would be consistent
- Make all the capitalization lowercase.
- Remove any trailing whitespace from the end of the strings.
- Replace spaces with underscores ('_').
dete_survey.head()
.dataframe tbody tr th {
    vertical-align: top;
}

.dataframe thead th {
    text-align: right;
}
print(dete_survey.columns)
#dete_survey_updated = dete_survey.iloc[:,[0, 1, 2, 3, 5,  -6, -7]]
dete_survey_updated = dete_survey.copy(deep = True)
dete_survey_updated.columns = dete_survey_updated.columns.str.lower().str.strip().str.replace('\s+', ' ').str.replace(' ','_')
dete_survey_updated.head()
Index(['ID', 'SeparationType', 'Cease Date', 'DETE Start Date',
       'Role Start Date', 'Position', 'Classification', 'Region',
       'Business Unit', 'Employment Status', 'Career move to public sector',
       'Career move to private sector', 'Interpersonal conflicts',
       'Job dissatisfaction', 'Dissatisfaction with the department',
       'Physical work environment', 'Lack of recognition',
       'Lack of job security', 'Work location', 'Employment conditions',
       'Maternity/family', 'Relocation', 'Study/Travel', 'Ill Health',
       'Traumatic incident', 'Work life balance', 'Workload',
       'None of the above', 'Gender', 'Age', 'Aboriginal', 'Torres Strait',
       'South Sea', 'Disability', 'NESB'],
      dtype='object')
.dataframe tbody tr th {
    vertical-align: top;
}

.dataframe thead th {
    text-align: right;
}
tafe_survey_updated = tafe_survey.copy(deep = True)
map_dict = {'Record ID': 'id',
'CESSATION YEAR': 'cease_date',
'Reason for ceasing employment': 'separationtype',
'Gender. What is your Gender?': 'gender',
'CurrentAge. Current Age': 'age',
'Employment Type. Employment Type': 'employment_status',
'Classification. Classification': 'position',
'LengthofServiceOverall. Overall Length of Service at Institute (in years)': 'institute_service',
'LengthofServiceCurrent. Length of Service at current workplace (in years)': 'role_service'}
tafe_survey_updated.rename(map_dict, axis = 1, inplace = True)
tafe_survey_updated.head()
.dataframe tbody tr th {
    vertical-align: top;
}

.dataframe thead th {
    text-align: right;
}
4. Filtering the Data
Recall that our end goal is to answer the following question: Are employees who have only worked for the institutes for a short period of time resigning due to some kind of dissatisfaction? What about employees who have been at the job longer?
If one sees the datasets, they would notice that the separationtype contains different separation types of the employees.
print('Unique values in dete \n',dete_survey_updated['separationtype'].value_counts())
print('\n \nUnique values in tafe \n',tafe_survey_updated['separationtype'].value_counts())
Unique values in dete
 Age Retirement                          285
Resignation-Other reasons               150
Resignation-Other employer               91
Resignation-Move overseas/interstate     70
Voluntary Early Retirement (VER)         67
Ill Health Retirement                    61
Other                                    49
Contract Expired                         34
Termination                              15
Name: separationtype, dtype: int64


Unique values in tafe
 Resignation                 340
Contract Expired            127
Retrenchment/ Redundancy    104
Retirement                   82
Transfer                     25
Termination                  23
Name: separationtype, dtype: int64
We are interested in ‘Resignation’ because our objective is that. In tafe, Resignation column is obvious, but in dete the following three columns have to be looked at
- Resignation-Other reasons
- Resignation-Other employer
- Resignation-Move overseas/interstate
# Using df.copy to not set SettingWithCopy Warning
pattern = r'^Resignation.*'
interested_df = dete_survey_updated[dete_survey_updated['separationtype'].str.contains(pattern)]
dete_resignations = interested_df.copy(deep = True)
print(dete_resignations.head())
tafe_resignations = tafe_survey_updated[tafe_survey_updated['separationtype'] == 'Resignation'].copy(deep = True)
tafe_resignations.head()
    id                        separationtype cease_date  dete_start_date  \
3    4             Resignation-Other reasons    05/2012           2005.0
5    6             Resignation-Other reasons    05/2012           1994.0
8    9             Resignation-Other reasons    07/2012           2009.0
9   10            Resignation-Other employer       2012           1997.0
11  12  Resignation-Move overseas/interstate       2012           2009.0

    role_start_date          position classification                region  \
3            2006.0           Teacher        Primary    Central Queensland
5            1997.0  Guidance Officer            NaN        Central Office
8            2009.0           Teacher      Secondary      North Queensland
9            2008.0      Teacher Aide            NaN                   NaN
11           2009.0           Teacher      Secondary  Far North Queensland

           business_unit    employment_status  ...   work_life_balance  \
3                    NaN  Permanent Full-time  ...               False
5   Education Queensland  Permanent Full-time  ...               False
8                    NaN  Permanent Full-time  ...               False
9                    NaN  Permanent Part-time  ...               False
11                   NaN  Permanent Full-time  ...               False

    workload  none_of_the_above  gender    age  aboriginal  torres_strait  \
3      False              False  Female  36-40         NaN            NaN
5      False              False  Female  41-45         NaN            NaN
8      False              False  Female  31-35         NaN            NaN
9      False              False  Female  46-50         NaN            NaN
11     False              False    Male  31-35         NaN            NaN

    south_sea  disability  nesb
3         NaN         NaN   NaN
5         NaN         NaN   NaN
8         NaN         NaN   NaN
9         NaN         NaN   NaN
11        NaN         NaN   NaN

[5 rows x 35 columns]
.dataframe tbody tr th {
    vertical-align: top;
}

.dataframe thead th {
    text-align: right;
}
5. Verify the Data
We will look at the datasets for any logical inconsistencies in any of the columns which we are interested in. As stated in the section 3, the columns which we are interested in dete_survey_updated are:
cease_datedete_start_dateagegender
Let us plot and visualize each of those columns.
unique_values_dete = {}
unique_values_dete['cease_date'] = dete_resignations['cease_date'].value_counts()
unique_values_dete['dete_start_date'] = dete_resignations['dete_start_date'].value_counts()
print(unique_values_dete['cease_date'])
print('\n\n****\n', unique_values_dete['dete_start_date'],'\n\n')

print(dete_resignations['cease_date'].value_counts().sum(), dete_resignations['dete_start_date'].value_counts().sum())
2012       126
2013        74
01/2014     22
12/2013     17
06/2013     14
09/2013     11
07/2013      9
11/2013      9
10/2013      6
08/2013      4
05/2012      2
05/2013      2
07/2012      1
07/2006      1
2010         1
09/2010      1
Name: cease_date, dtype: int64


****
 2011.0    24
2008.0    22
2007.0    21
2012.0    21
2010.0    17
2005.0    15
2004.0    14
2009.0    13
2006.0    13
2013.0    10
2000.0     9
1999.0     8
1996.0     6
2002.0     6
1992.0     6
1998.0     6
2003.0     6
1994.0     6
1993.0     5
1990.0     5
1980.0     5
1997.0     5
1991.0     4
1989.0     4
1988.0     4
1995.0     4
2001.0     3
1985.0     3
1986.0     3
1983.0     2
1976.0     2
1974.0     2
1971.0     1
1972.0     1
1984.0     1
1982.0     1
1987.0     1
1975.0     1
1973.0     1
1977.0     1
1963.0     1
Name: dete_start_date, dtype: int64


300 283
Looking at the unique values, one thing is obvious, if we want to compare the columns cease_date and dete_start_date both should be in the same format. Right now, some rows in cease_date are in MM/YYYY format, if they are made to be in YYYY format, there will be consistemcy and it will be easy to compare.
# CAREFUL ::: This line should be executed only once
dete_resignations['cease_date'] = dete_resignations['cease_date'].str.split(pat = '/').str[-1].astype(np.float64)
dete_resignations['cease_date'].value_counts()
dete_resignations['dete_start_date'].value_counts()
# Now the format is same for cease_date and dete_start_date
2011.0    24
2008.0    22
2007.0    21
2012.0    21
2010.0    17
2005.0    15
2004.0    14
2009.0    13
2006.0    13
2013.0    10
2000.0     9
1999.0     8
1996.0     6
2002.0     6
1992.0     6
1998.0     6
2003.0     6
1994.0     6
1993.0     5
1990.0     5
1980.0     5
1997.0     5
1991.0     4
1989.0     4
1988.0     4
1995.0     4
2001.0     3
1985.0     3
1986.0     3
1983.0     2
1976.0     2
1974.0     2
1971.0     1
1972.0     1
1984.0     1
1982.0     1
1987.0     1
1975.0     1
1973.0     1
1977.0     1
1963.0     1
Name: dete_start_date, dtype: int64
import matplotlib.pyplot as plt
%matplotlib inline
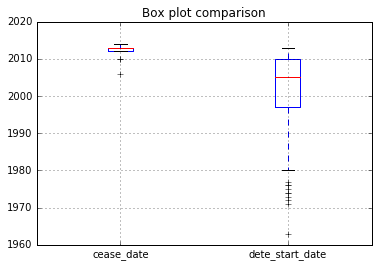
fig = dete_resignations.boxplot(column = ['cease_date', 'dete_start_date'])
plt.title( 'Box plot comparison' )
#plt.suptitle('') # that's what you're after
plt.show()
'''fig, (ax1, ax2) = plt.subplots(1, 2)
ax1 = dete_survey_updated['cease_date'].plot(kind='hist')
ax2 = dete_survey_updated['dete_start_date'].plot(kind='hist')
plt.show()'''

fig, (ax1, ax2) = plt.subplots(1, 2, figsize = (10,5))
ax1.hist(dete_resignations['cease_date'].dropna(), alpha = 0.5) #Histogram cannot deal with Nan values
ax1.axis(xmin=2004,xmax=2016)
ax1.set_title('cease_date histogram')
ax2.hist(dete_resignations['dete_start_date'].dropna(), alpha = 0.5)
ax2.set_title('dete_start_date histogram')
plt.show()
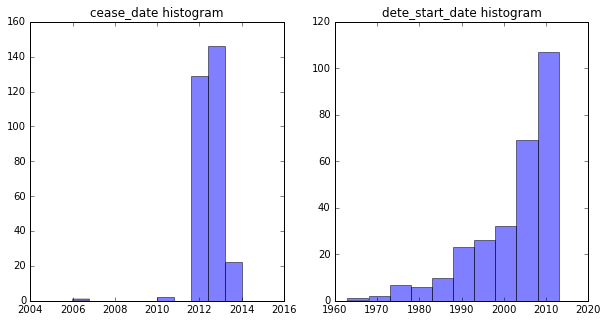
Observations
cease_dateis a more narrow distribution thandete_start_date- Suddenly many people left at 2012 and 2013 (Any peculiar reason ?)
- In
dete_start_dateit can be seen that many people started working from 1965, 1970s onwards.
Overall the data looks Ok and there are no logical inconsistencies
6. Creating a new column : Length of service
tafe_resignations dataframe already contains a “service” column, which we renamed to institute_service. In order to analyze both surveys together, we’ll have to create a corresponding institute_service column in dete_resignations.
Since we know the starting date of the service (dete_start_date) and resignation date (cease_date), we can calculating the institute_service column by subtracting the both
dete_resignations['institute_service'] = dete_resignations['cease_date'] - dete_resignations['dete_start_date']
# value counts in percentages
dete_resignations['institute_service'].value_counts()*100/dete_resignations['institute_service'].value_counts().sum()
5.0     8.424908
1.0     8.058608
3.0     7.326007
0.0     7.326007
6.0     6.227106
4.0     5.860806
9.0     5.128205
2.0     5.128205
7.0     4.761905
13.0    2.930403
8.0     2.930403
20.0    2.564103
15.0    2.564103
10.0    2.197802
22.0    2.197802
14.0    2.197802
17.0    2.197802
12.0    2.197802
16.0    1.831502
18.0    1.831502
23.0    1.465201
11.0    1.465201
24.0    1.465201
39.0    1.098901
19.0    1.098901
21.0    1.098901
32.0    1.098901
28.0    0.732601
26.0    0.732601
25.0    0.732601
30.0    0.732601
36.0    0.732601
29.0    0.366300
33.0    0.366300
42.0    0.366300
27.0    0.366300
41.0    0.366300
35.0    0.366300
38.0    0.366300
34.0    0.366300
49.0    0.366300
31.0    0.366300
Name: institute_service, dtype: float64
It should be noted that, more than 35% of the people resigned within the first 5 years of the service with the institute. Hence it should be analysed why people resigned, Are they dissatisfied or is there any other reason.
7. Identifying Dissatisfied Employees
Below are the columns we’ll use to categorize employees as “dissatisfied” from each dataframe. If you disagree, feel free to modify them! Just make sure you explain why you made that decision.
tafe_survey_updated:
- Contributing Factors. Dissatisfaction
- Contributing Factors. Job Dissatisfaction
dete_survey_updated:
- job_dissatisfaction
- dissatisfaction_with_the_department
- physical_work_environment
- lack_of_recognition
- lack_of_job_security
- work_location
- employment_conditions
- work_life_balance
- workload
If the employee indicated any of the factors above caused them to resign, we’ll mark them as dissatisfied in a new column.
print(tafe_resignations['Contributing Factors. Dissatisfaction'].value_counts())
#print(tafe_resignations[tafe_resignations['Contributing Factors. Dissatisfaction'] == 'Contributing Factors. Dissatisfaction '])

print('\n\n***** Job Dissatisfacion ****** \n')
print(tafe_resignations['Contributing Factors. Job Dissatisfaction'].value_counts())
#print(tafe_resignations[tafe_resignations['Contributing Factors. Job Dissatisfaction'] == 'Job Dissatisfaction'])
-                                         277
Contributing Factors. Dissatisfaction      55
Name: Contributing Factors. Dissatisfaction, dtype: int64


***** Job Dissatisfacion ******

-                      270
Job Dissatisfaction     62
Name: Contributing Factors. Job Dissatisfaction, dtype: int64
def update_vals(element):
    if pd.isnull(element):
        return np.nan
    elif element == '-':
        return False
    else:
        return True


tafe_resignations[['Contributing Factors. Dissatisfaction', 'Contributing Factors. Job Dissatisfaction']] = tafe_resignations[['Contributing Factors. Dissatisfaction', 'Contributing Factors. Job Dissatisfaction']].applymap(update_vals)
Here, we updated the values in the Contributing Factors. Dissatisfaction and Contributing Factors. Job Dissatisfaction in the tafe_resignations dataframe so that each contains only True, False, or NaN values. To achieve that, we wrote a function named update_vals that makes the following changes:
- If the value is NaN, return np.nan. We used the following criteria to check that a value is NaN: pd.isnull(val).
- If the value is ‘-’, return False.
- For any other value, return True.
We also used the DataFrame.applymap() method to apply the function above to the Contributing Factors. Dissatisfaction and Contributing Factors. Job Dissatisfaction in the tafe_resignations dataframe.
Remember that we need to pass the update_vals function into the df.applymap() method without parentheses.
Next,
- We will use the
df.any() methodto create a dissatisfied column in BOTH thetafe_resignationsanddete_resignationsdataframes. - We will use the
df.copy() methodto create a copy of the results and avoid the SettingWithCopy Warning assigning the results todete_resignations_upandtafe_resignations_up.
tafe_resignations['dissatisfied'] = tafe_resignations[['Contributing Factors. Dissatisfaction','Contributing Factors. Job Dissatisfaction']].any(axis = 1, skipna = False)
tafe_resignations['dissatisfied']
3      False
4      False
5      False
6      False
7      False
8      False
9      False
10     False
13     False
14      True
15     False
16       NaN
17      True
18       NaN
19     False
20      True
21     False
22     False
23     False
24     False
26      True
27     False
29     False
32     False
36     False
37     False
39     False
40      True
41     False
42     False
       ...
659    False
660    False
661     True
665    False
666    False
669    False
670      NaN
671     True
675     True
676    False
677    False
678    False
679    False
681    False
682    False
683    False
684    False
685     True
686    False
688    False
689     True
690    False
691    False
693    False
694    False
696    False
697    False
698    False
699    False
701    False
Name: dissatisfied, Length: 340, dtype: object
tafe_resignations['dissatisfied'] columns looks ok and thus we can apply this method to dete_resignations too.
list_dete = ['job_dissatisfaction', 'dissatisfaction_with_the_department', 'physical_work_environment',
             'lack_of_recognition', 'lack_of_job_security','work_location', 'employment_conditions',
             'work_life_balance', 'workload']

dete_resignations['dissatisfied'] = dete_resignations[list_dete].any(axis = 1, skipna = False)
#dete_resignations['dissatisfied']
print(dete_resignations.shape)
dete_resignations['dissatisfied'].value_counts()
(311, 37)


False    162
True     149
Name: dissatisfied, dtype: int64
dete_resignations_up = dete_resignations.copy()
tafe_resignations_up = tafe_resignations.copy()
We are using the df.copy() method to create a copy of the results and avoid the SettingWithCopy Warning
8. Combining the Data
We have two datasets right now, dete_resignations_up and tafe_resignations_up. We have to combine our datasets! Our end goal is to aggregate the data according to the institute_service column, so when you combine the data, think about how to get the data into a form that’s easy to aggregate.
First, let’s add a column to each dataframe that will allow us to easily distinguish between the two.
- Let’s add a column named
institutetodete_resignations_up. Each row should contain the valueDETE. - Let’s add a column named
institutetotafe_resignations_up. Each row should contain the valueTAFE.
dete_resignations_up['institute'] = 'DETE'
tafe_resignations_up['institute'] = 'TAFE'
print(dete_resignations_up.shape, tafe_resignations_up.shape)
(311, 38) (340, 25)
combined = pd.concat([dete_resignations_up, tafe_resignations_up], axis=0)
print(combined.shape)
combined
(651, 53)
.dataframe tbody tr th {
    vertical-align: top;
}

.dataframe thead th {
    text-align: right;
}
It could be seen that there are many columns which have NaN values. It could be argued that, if a column has too many NaN values, since NaN values will be discarded for the data analysis, that data representation is not correct across all the samples and such columns should be discarded from the data analysis. There are a total of 651 rows, hence arbitrarily, we can choose that if a column has less than 500 non null values, we can drop that column.
print(combined.shape)
combined_updated = combined.dropna(axis = 1, thresh = 500)
print(combined_updated.shape)
(651, 53)
(651, 10)
Wow, we can see that 53 columns are reduced to 10.
9. Cleaning the Service Column
combined_updated['institute_service'].value_counts(dropna = False)
NaN                   88
Less than 1 year      73
1-2                   64
3-4                   63
5-6                   33
11-20                 26
5.0                   23
1.0                   22
7-10                  21
0.0                   20
3.0                   20
6.0                   17
4.0                   16
9.0                   14
2.0                   14
7.0                   13
More than 20 years    10
8.0                    8
13.0                   8
15.0                   7
20.0                   7
10.0                   6
12.0                   6
14.0                   6
22.0                   6
17.0                   6
18.0                   5
16.0                   5
11.0                   4
23.0                   4
24.0                   4
19.0                   3
39.0                   3
32.0                   3
21.0                   3
26.0                   2
28.0                   2
30.0                   2
36.0                   2
25.0                   2
27.0                   1
29.0                   1
31.0                   1
49.0                   1
33.0                   1
34.0                   1
35.0                   1
38.0                   1
41.0                   1
42.0                   1
Name: institute_service, dtype: int64
These are too many values and for our analysis to be effective, we will segragate all into a group of 4 according to this article. These are
- New: Less than 3 years at a company
- Experienced: 3-6 years at a company
- Established: 7-10 years at a company
- Veteran: 11 or more years at a company
Let us categororise institute_service into the above
institute_processed_series = combined_updated['institute_service'].astype('str').str.replace(r'\.0$','').astype('str').str.findall(r'[0-9]+')


# s = pd.Series(['NaN','7','3','11', 'Less than 1 year', '1-2', '11-20', '30','10.0','7-10','5-6', 'More than 15.0 years', '5.0'])
# s2 = s.str.replace(r'\.0','').astype('str').str.findall(r'[0-9]+')
# print(s2)

def service_cat_func(list_elements):
    #print(list_elements, type(list(list_elements)))
    list_elements = list(list_elements)
    list_elements = [float(item) for item in list_elements]
    val1 = 3 # Criteria for dividing service into 4 groups
    val2 = 7
    val3 = 11

    if not list_elements:
        # List is empty
        return np.nan
    else:
        #print(ele for ele in list_elements)
        condn_group1 = all(ele< val1 for ele in list_elements)
        condn_group2 = all((ele>= val1 and ele<= val2 - 1) for ele in list_elements)
        condn_group3 = all((ele>= val2 and ele<= val3 -1 ) for ele in list_elements)
        condn_group4 = all(ele>= val3 for ele in list_elements)

        if condn_group1 and not (condn_group2 or condn_group3 or condn_group4):
            return 'New'
        elif condn_group2 and not (condn_group1 or condn_group3 or condn_group4):
            return 'Experienced'
        elif condn_group3 and not (condn_group2 or condn_group1 or condn_group4):
            return 'Established'
        elif condn_group4 and not (condn_group2 or condn_group3 or condn_group1):
            return 'Veteran'
        else:
            return 'Logical Error!!!'


combined_updated['service_cat'] = institute_processed_series.apply(service_cat_func)
#combined_updated[combined_updated['service_cat'] == 'Logical Error!!!']
combined_updated['service_cat'].value_counts(dropna = False)

# s2.apply(service_cat_func)
/dataquest/system/env/python3/lib/python3.4/site-packages/ipykernel/__main__.py:39: SettingWithCopyWarning:


A value is trying to be set on a copy of a slice from a DataFrame.
Try using .loc[row_indexer,col_indexer] = value instead

See the caveats in the documentation: http://pandas.pydata.org/pandas-docs/stable/indexing.html#indexing-view-versus-copy


New            193
Experienced    172
Veteran        136
NaN             88
Established     62
Name: service_cat, dtype: int64
Note: The warning of SettingWithCopyWarning is present because of the way the new column of service_cat is added on to the dataframe of combined_updated. However, it can be ignored because always the value of service_cat will be dependent on the institute_service column.
10. Performing Intial Analysis
The dissatisfied column consists of Boolean values, meaning they’re either True or False. Methods such as the df.pivot_table() method actually treat Boolean values as integers, so a True value is considered to be 1 and a False value is considered to be 0. That means that we can aggregate the dissatisfied column and calculate the number of people in each group, the percentage of people in each group, etc.
combined_updated['dissatisfied'].value_counts(dropna = False)
False    403
True     240
NaN        8
Name: dissatisfied, dtype: int64
We will fill the missing values in the column dissatisfied with the most frequently occuring value, i.e False
combined_updated['dissatisfied'].fillna(False, inplace = True)
combined_updated['dissatisfied'].value_counts(dropna = False) # expected no of False = 411, True = 240
/dataquest/system/env/python3/lib/python3.4/site-packages/pandas/core/generic.py:4355: SettingWithCopyWarning:


A value is trying to be set on a copy of a slice from a DataFrame

See the caveats in the documentation: http://pandas.pydata.org/pandas-docs/stable/indexing.html#indexing-view-versus-copy


False    411
True     240
Name: dissatisfied, dtype: int64
pd.pivot_table(combined_updated, index = 'service_cat',values = 'dissatisfied', aggfunc = np.mean)
.dataframe tbody tr th {
    vertical-align: top;
}

.dataframe thead th {
    text-align: right;
}
- This implies that more than 50% of the
Establishedpersons are dissatisfied. - It also shows that the
Newor slightltyExperiencedcategory people are not that dissatisfied. - Dissatisfaction increases as the employee’s time within the institute increases, and peaks around 7-10 years time, before decreasing slightly later
print(combined_updated['institute'].value_counts())
table1 = pd.pivot_table(combined_updated, index = 'service_cat', columns = 'institute', values = 'dissatisfied', aggfunc = np.mean)
desired_index = ['New', 'Experienced', 'Established', 'Veteran']
table1 = table1.reindex(desired_index)
ax = table1.plot.bar(rot= 30, ylim=[0,1])
ax.set_title('Fig-1 : Fraction of people dissatisfied who Resigned')
TAFE    340
DETE    311
Name: institute, dtype: int64


<matplotlib.text.Text at 0x7f2072600668>
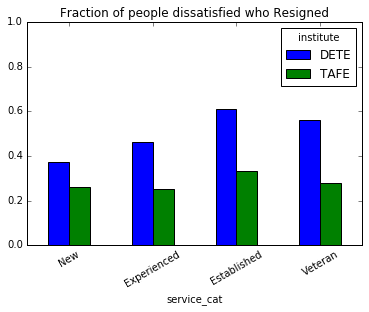
According to these two survethere are roughly same number of employees among DETE and TAFE, 311 and 340 respectively. Among the employees who resigned, we can observe the following.
DETEhas more dissatisfaction thanTAFE, in some categories upto 60%- In the case of
DETE, dissatisfaction among the employees increased as they spent more time with the institute, peaking at 7-11 years, and slightly decreased among the employees who spent more than 11 years; whereas for theTAFEinstitute, the situtation is more or less the same irrespective of the time spent with the institute.
These suggest that something is probably wrong with DETE than TAFE
combined_updated['age'].value_counts(dropna = False)
41-45                  93
46-50                  81
36-40                  73
51-55                  71
26-30                  67
21-25                  62
31-35                  61
56-60                  55
NaN                    55
61 years or older      23
20 years or younger    10
Name: age, dtype: int64
This suggests we have to clean the age column in the dataframe
11. Cleaning the age column
The age column can be categorized as follows:
-
20 years or younger
-
21 - 25
-
26 - 30
""""""
-
51 - 55
-
56 - 60
-
60 years or older
#age_processed_series = combined_updated['age'].astype('str').str.replace(r'\.0$','').astype('str').str.findall(r'[0-9]+')
processed_age_series = combined_updated['age'].str.replace(r'\.0','').astype('str').str.findall(r'[0-9]+')

# test_series = pd.Series(['NaN','51-55','41  45','56 or older', '20 or younger', '61 or older','31  35'])
# processed_test_series = test_series.str.replace(r'\.0','').astype('str').str.findall(r'[0-9]+')
# print(processed_test_series)

def clean_age(age_bracket):
    '''
    Function to clean the age column from the dataset. I/p: list of age, o/p: returns which category in string
    '''
    age_bracket = [int(element) for element in age_bracket]
    age_category = [[0, 20]] # 20 years or younger
    for num in range(20, 60, 5):
        age_category.append([num+1, num+5])
    age_category.append([61, 100])  # 61 years or older
    #print(age_category)

    if not age_bracket:
        # Requested age bracket is empty
        return np.nan
    else:
        for sub_cat in age_category:
            if all(element >= sub_cat[0] and element <= sub_cat[1] for element in age_bracket):
                if sub_cat[0] == 0:
                    return '20 years or younger'
                elif sub_cat[0] == 61:
                    return '61 years or older'
                else:
                    return '{}-{}'.format(sub_cat[0], sub_cat[1])

            else:
                pass

combined_updated['age'] = processed_age_series.apply(clean_age)
combined_updated['age'].value_counts(dropna = False)
/dataquest/system/env/python3/lib/python3.4/site-packages/ipykernel/__main__.py:35: SettingWithCopyWarning:


A value is trying to be set on a copy of a slice from a DataFrame.
Try using .loc[row_indexer,col_indexer] = value instead

See the caveats in the documentation: http://pandas.pydata.org/pandas-docs/stable/indexing.html#indexing-view-versus-copy


41-45                  93
46-50                  81
36-40                  73
51-55                  71
26-30                  67
21-25                  62
31-35                  61
56-60                  55
NaN                    55
61 years or older      23
20 years or younger    10
Name: age, dtype: int64
age column is cleaned from the dataset and we can proceed with the analysis corresponding to the relation between the various age bracket of the resigned employees and how many of them are dissatisfied
table2 = pd.pivot_table(combined_updated, index = 'age', columns = ['institute'], values = 'dissatisfied', aggfunc = np.mean)
desired_index = ['20 years or younger','21-25','26-30','31-35','36-40','41-45','46-50','51-55','56-60', '61 years or older']
table2 = table2.reindex(desired_index)
ax = table2.plot.bar(rot= 90, ylim=[0,1])
ax.set_title('Fig-2 : Fraction of people dissatisfied who Resigned')
plt.show()
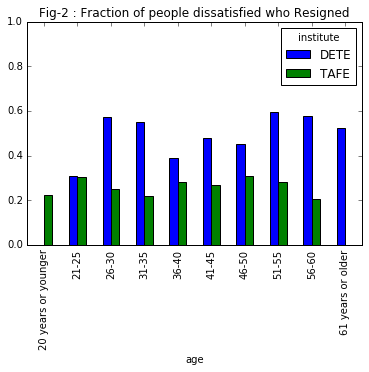
These results are also indicate that out of the employees who resigned,
- Employees from
DETEare dissatisfied than fromTAFE - Interestingly, in
Fig-1, the highest percentage of dissatisfied resigned employees were from theEstablishedcategory, i.e, their service tenure is around7-10years. If we assume that most of the persons started their career at theDETEaround an age of26-30, their age at the time of resignation should have been at36-40. But we are actually seeing a dip in the % of dissatisfied employees in theFig-2
We will carryout additional analysis regarding that. But before, we will take a look at the table currently, and we will decide which columns give us more insight to carryout additional analysis of the dissatisfied employees
combined_updated.head()
combined_updated['gender'].value_counts()
Female    424
Male      168
Name: gender, dtype: int64
Resigned employees are predominantly Female, almost 3.5x than Male. Is the intake of the employees in this proportion or does the Female employees are resigning in this proportion???
table3 = pd.pivot_table(combined_updated, index = 'age', columns = ['institute','gender','service_cat'], values = 'dissatisfied', aggfunc = np.mean)
table3
.dataframe tbody tr th {
    vertical-align: top;
}

.dataframe thead tr th {
    text-align: left;
}

.dataframe thead tr:last-of-type th {
    text-align: right;
}
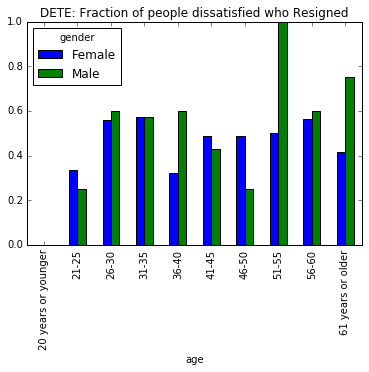
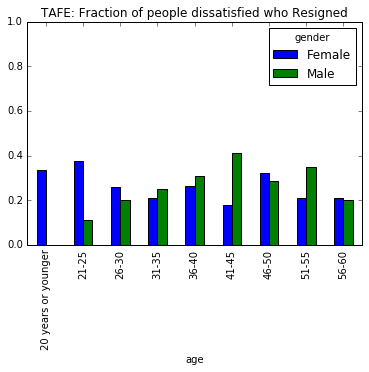
12. Analysis by Gender
table4 = pd.pivot_table(combined_updated[combined_updated['institute']=='DETE'], index = 'age', columns = ['gender'], values = 'dissatisfied', aggfunc = np.mean)
table5 = pd.pivot_table(combined_updated[combined_updated['institute']=='TAFE'], index = 'age', columns = ['gender'], values = 'dissatisfied', aggfunc = np.mean)

ax1 = table4.plot.bar(rot= 90, ylim=[0,1])
ax1.set_title('DETE: Fraction of people dissatisfied who Resigned')
ax2 = table5.plot.bar(rot= 90, ylim=[0,1])
ax2.set_title('TAFE: Fraction of people dissatisfied who Resigned')
plt.show()
13. Summary and conclusion
Summary of the analysis is that
- Suddenly, many people resigned in 2012 and 2013 (Any peculiar reason ?)
- For DETE, more than 35% of the people resigned within the first 5 years of the service with the institute.
- When we cateogorize employees into their tenure of service,it is observed that the
Newor slightltyExperiencedcategory people are not that dissatisfied. - DETE has more dissatisfaction than TAFE, in some categories upto 60%
- In the case of DETE, dissatisfaction among the employees increased as they spent more time with the institute, peaking at 7-11 years, and slightly decreased among the employees who spent more than 11 years; whereas for the TAFE institute, the situtation is more or less the same irrespective of the time spent with the institute. These suggest that something is probably wrong with
DETEthanTAFE. - Resigned employees are predominantly Female, almost 3.5x than Male. However, analysis by the gender suggested that in
DETEin terms of percentages wise,Femaleemployeess didn’t resign more thanMaleemployees because of dissatisfaction suggesting the reason for dissatisfaction is not gender bias in the institute.